4 Most Crucial Technical Indicators You Should Know About
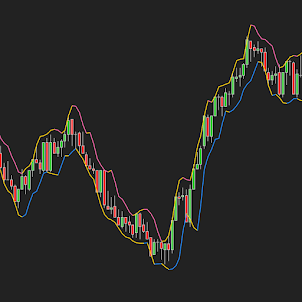
Trading indicators are used in the form of strategy by every technical trader. Along with the best risk management tools, it can help traders gain many more insights into price trends. Whether you're into share trading, forex trading, or commodities trading, using technical analysis or the NinjaTrader 8 indicators as a strategy will be helpful. Trading indicators are viewed as mathematical calculations plotted as lines on the price chart. It helps all traders to detect specific trends and signals within the trading market.
The Various Types of Technical Indicators
Regarding trading indicators, there are several different kinds of them, including both lagging and leading indicators. The lagging indicator looks at all the previous trends and then indicates the momentum, and the leading one is a forecast signal, which predicts all future price movements. Here are some of the primary technical indicators:
- MA or Moving Average
A simple Moving Average [SMA] or MA is an indicator utilized for identifying the direction of the existing price trends. This is done without any interference from short-term price spikes.
The moving average indicator blends the specified time frame over the price points of a monetary instrument and then divides it by data points. Doing so helps present a single trend line.
Moreover, the data used here will depend heavily on the MA's length. For instance, a 200-days moving average will need 200 days of data.
When you use the moving average indicator, you can easily study all the resistance and support levels and check out all the past price actions. This can also help you determine all the future patterns with no hassle.
- EMA or Exponential Moving Average
This is another type of moving average. Compared to SMA, the exponential moving average places much more weight on the current data points. This makes the data a lot more responsive to all the latest information. When this indicator is utilized with various other indicators, it can help all the traders confirm the market moves and gauge their legitimacy. Currently, the most well-known EMAs are the 12-day and 26-day for the short-term averages, and the 50-day and 200-day ones are for the long-term indicators.
- RSI or Relative Strength Index
The relative strength index is mainly utilized to detect momentum, warning signals, and market signals for all risky price movements. This indicator is presented as a figure between 0 and 100. A 70-level asset is viewed as an overbought, and an asset near or at level 30 is viewed as oversold.
Overbought signals recommend that all the short-term profits might reach a point of maturity and the assets will be under a price correction. Besides, the oversold signals could show that all the short-term declines will reach maturity, and the assets will be in for the rally.
- Ichimoku Cloud
Like all the other NinjaTrader 8 indicators, the Ichimoku Cloud also detects the resistance and support levels. Besides that, it can offer all the trader's signals and estimate the price momentum. This can surely help the traders with their respective decision-making.
Here, "Ichimoku" translates to "one-look equilibrium chart' and this is why it's used by all the traders who require plenty of information from one chart. In a nutshell, the indicator can show all the existing resistance and support levels, detect market trends, and forecast future levels.
Final Thoughts
Conducting proper trading analysis is extremely important for all the traders out there. Although numerous trading indicators are available in the market, the ones mentioned in this post are the most vital ones.


Comments
Post a Comment